Spatial Intra- Luminal Pressure Gradients and Variance
Spatial Intra- Luminal Pressure Gradient and Variance of Esophageal Pressure Magnitudes in Achalasia Sub-types and Healthy Controls
Manometric evaluation of achalasia has focused on second-level pressure metrics derived from deglutitive esophageal isocontour maps. While metric evaluation like the Chicago Classification methods have revealed valuable insights, evaluation of amassed manometric isocontours, such as that of the Milwaukee ManoBank, showing esophageal isocontours across many subjects for intraluminal pressure gradient and pressure variance could further our understanding of the pathophysiology of this disorder. Thus, we seek to evaluate 1) Deglutitive esophageal isocontours for mean (the average isocontour) and variance of pressure magnitudes (the standard deviation (SD) isocontour) across many subjects and 2) Over the entire isocontour, statistically compare and display significant pressure gradient differences between achalasia subtypes and with healthy controls.
We studied 980 swallows across 52 healthy subjects (50±14 yrs,20F) and 46 achalasia patients (55±17, 19F) using high resolution manometry. Achalasia sub-types included 16 type I, 18 type II and 12 type III patients defined by the Chicago Classification criteria. All subjects performed 5 ml water swallows (x10). Each swallow was normalized by defining “time zero” as the instant of initial deglutitive upper esophageal sphincter (UES) relaxation and by defining the inter-sphincteric esophageal length. In addition to characterizing average and SD, we also tested group differences spanning the entire isocontour across all groups.
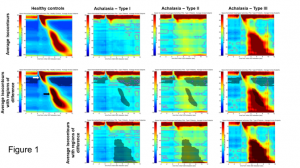
 Average isocontours (top four graphs, figure 5) are different across the achalasia sub-types from those of healthy subjects (p<0.0001, regions of differences shown in the middle four graphs as black overlays). Regional differences are just below the UES (white arrow) and along the distal
  esophagus (black arrow). Also shown in figure 5 (bottom three graphs) are differences across the achalasia sub-types in the distal esophagus. As seen in figure 6, the SD isocontour reveals substantial variance in the healthy control subjects and type I achalasia patients in the distal esophagus. Furthermore, a second level analysis of the spatial pressure gradient along the length of the esophagus shows organized contraction for healthy subjects but disorganized pressure gradients for the achalasia sub-types.
The amassed, normalized manometric isocontours showed group-wise characteristics of the mean and variance of esophageal pressure magnitudes while statistically comparing and displaying significant pressure differences between healthy controls and achalasia patients. The large database methods reveal characteristics of the entire space-time pressure recording and substantive difference in isocontours between healthy controls and achalasia patients as well as between sub-types of achalasia.
