Advantages of Isocontour Analysis
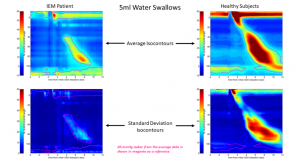
A principle advantage of comparing the entire isocontour is the ability show both “where” and “when” pressure values fall outside of the range of normative confidence interval values during a physiologic event. As an example, the average esophageal isocontour from 190 five-ml water swallows (10 swallows in each of 19 subjects) is shown next to the average isocontour of 10 five-ml water swallows from a patient diagnosed with ineffective esophageal motility (IEM) in figure 4.
 For this example, all isocontours have been normalized temporally by designating “time zero” to be the moment of initial deglutitive UES relaxation and normalized spatially by scaling all data to the length from the lower margin of the UES high pressure zone (space reference “zero” percent of the esophageal length) to the upper margin of the lower esophageal sphincter (LES) high pressure zone wherein the margins of these zones are demarcated by the 20-mmHg isobar.
As seen in the two upper graphs of figure 4, the average isocontours for the IEM patient and healthy subjects are qualitatively different in that the esophageal contractile pressures are diminished across much of the esophageal body. The robust sample of pressure data also yields information regarding where and when the dispersion (or error) of the data is greatest as is seen in the standard deviation isocontours of figure 4.
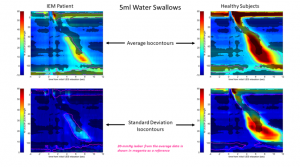
From the standard deviation isocontours, the level of dispersion of the IEM patient data is markedly less than that of the healthy average data indicating, while the patient’s contractility is less than that of healthy subjects, the patient data is less variable than the healthy subject data. With average and error measurements in hand, hypothesis testing using common statistical methods like Student’s t-tests and analysis of variance may be performed. From the example in figure 4, the regions of the isocontour wherein IEM patient data falls outside of the 99% confidence interval of the healthy subject data are shown in figure 5 wherein these regions are shown overlaid in black on the isocontours.
 As seen, the portions of the isocontour that are significantly different in the IEM patient data are most conspicuously apparent in the contractility of the esophageal striated muscle region near the distal margin of the UES at times early in the deglutitive esophageal contraction sequence. Regions of difference are also shown in the transition zone and in the later part of the smooth muscle contraction of the smooth muscle esophagus just distal to the transition zone.
