Hierarchical Clustering of Esophageal Isocontours
Agglomerative Hierarchical Clustering of Esophageal Body Manometric Isocontour Data: Similarities and Differences Across Four Patient Groups and Healthy Subjects
Evaluation of esophageal motor function has historically relied on derived metrics like peristaltic pressure wave amplitude, velocity, duration or LES relaxation and more recently contractile integral and integrated LES relaxation pressure. An alternative method of characterizing esophageal isocontour data is hierarchical clustering of pressure signatures to detect similarities and differences. In this study, we determined similarities and differences of the deglutitive pressure signature of the inter-sphincteric esophagus among healthy control and patients using agglomerative hierarchical clustering techniques.
We studied 3420 manometric recordings deposited in the Milwaukee ManoBank from 52 healthy subjects (50±14 yrs,20F), 46 achalasia (55±17, 19F, with 16 type I, 18 type II and 12 type III), 20 EGJOO (60±15, 16F), 106 symptomatic patients with normal manometry (52±16, 56F) and 118 IEM patients (57±15, 71F) using high resolution manometry. Patients were identified using the Chicago Classification criteria. All subjects performed 5 ml water swallows (x10). Each swallow was normalized by defining “time zero” as the instant of initial deglutitive upper esophageal sphincter (UES) relaxation and by defining the inter-sphincteric esophageal length. To reduce dimensionality, 50 pan-esophageal channels of normalized pressure as a function of time were concatenated from the most proximal to the most distal channel. These “pseudo-timeseries” were then grouped using agglomerative hierarchical clustering forming clusters of isocontours pressure signatures that are like one another and unlike other clusters.
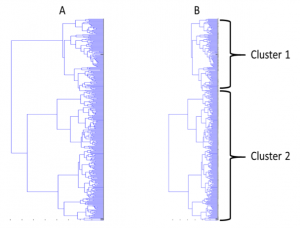
 As seen in the dendrogram of figure 9A, the data form distinct clusters. Figure 9B shows the formation of 2 clusters. The members of these 2 clusters are shown in Table 1 as percentages of each diagnostic group within each cluster. As seen, manometric signature of 94% of healthy volunteers cluster in one group and 6% in
  another. As a function of differentiating ability of the technique, achalasia type I and II essentially cluster in one group and symptomatic patients with normal manometry virtually mirror the healthy controls. As seen only half of other groups exhibit clustering pattern dissimilar to healthy controls. Nearly half of these groups cluster with healthy controls.
Clustering techniques to differentiate the entirety of the esophageal body pressure isocontour provides evidence for heterogeneity of esophageal body pressure phenomena among patients with IEM, EGJOO and type III achalasia. Esophageal pressure signatures of only about half of these patient groups clusters differently from healthy controls suggesting that in nearly half these patients the source for their symptom may reside elsewhere.
Machine Learning Techniques for Classifying High Resolution Manometric Isocontours
Machine learning techniques have been applied to single or grouped metrics to classify membership in various groups across disciplines as diverse as recognizing the locations of transcription start sites in a genome sequences to medical records identification of optimal treatment modalities; however, application of this sophisticated classification technique has not been systematically applied to high resolution esophageal manometric data as a tool for classifying patients from healthy volunteers. Therefore, we will establish the feasibility of utilizing support vector machine (SVM) classification techniques to differentiate the entirety of esophageal pressure isocontours in patients with IEM from isocontours in healthy subjects. 2) Characterize the sensitivity (Sens), specificity (Spec), accuracy (Acc) and other statistical performance measures for the tested classification technique. We used Ineffective Esophageal Motility (IEM) patients as test group.
We studied 1800 swallows across 52 healthy subjects (50±14 yrs,20F) and 128 IEM patients (57±15, 71F) using high resolution manometry. IEM patients were identified by the Chicago Classification. All subjects performed 5 ml water swallows (x10). Each swallow was normalized by defining “time zero” as the instant of initial deglutitive upper esophageal sphincter (UES) relaxation and by defining the inter-sphincteric esophageal length. To reduce dimensionality, 50 pan-esophageal channels of normalized pressure as a function of time were concatenated from the most proximal to the most distal channel. These “pseudo-timeseries” were then classified using an SVM classification algorithm wherein half the data was used to train the classifier and half the data was used to test the classifier. Since the choice of which halves of the data used for training may influence the resulting classification, random selections of patients and controls for 1000 Monte Carlo simulations were analyzed to yield average values for performance parameters.
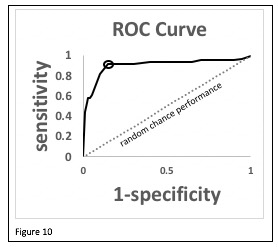
Figure 10 shows the receiver operating characteristics (ROC) curve for the average performance measures. The optimal performance point is circled on the ROC curve (sensitivity=0.93, specificity=0.86). As is further seen in table 2, the classification performance measures were much greater than those expected by chance.
We have established the feasibility of utilizing SVM classification to differentiate the entirety of esophageal isocontours and characterized statistical measures of performance for classifying a test group of IEM patients compared to healthy controls. Future prospective studies of different patient groups as well as larger numbers of patient and control participants are needed to confirm these findings.
Table 2
| Acc | 0.91±0.03 |
| Sens | 0.93±0.04 |
| Spec | 0.86±0.06 |
| Positive Predictive Value | 0.95±0.02 |
| Negative Predictive Value | 0.83±0.07 |
| Area under the ROC curve | 0.89±0.04 |
Spectral Analysis of Esophageal Manometric Isocontour Data: A Study of 3420 Swallows in 342 Patients and Controls
Esophageal pressure phenomena characterized by metrics such as contractile integrals and integrated relaxation pressures are mainly focused on pressure magnitudes at specific places and times within the manometric isocontour. Variability of these metrics reduces their diagnostic reliability. We hypothesized that utilizing frequency characteristics of deglutitive pressures over the entire length of esophagus may provide insight into pathophysiology and a complementary approach to these metrics to classify patients. Our aims in this study were: 1) to test feasibility of using frequency analysis of esophageal body pressure isocontours for classification of patients diagnosed with various motility disorders. 2) Using Linear Discriminant Analysis (LDA), characterize and compare among groups the performance of two frequency metrics of deglutitive esophageal pressure waves.
We studied 3420 water swallows (5 ml x10 per subject) across 52 healthy subjects (50±14 yrs,20F), 46 achalasia (55±17, 19F, with 16 type I, 18 type II and 12 type III), 20 EGJOO (60±15, 16F), 106 Clinical Normal (52±16, 56F) and 118 IEM patients (57±15, 71F) using high resolution manometry. Patients were identified using the Chicago Classification criteria. Data were obtained from the ManoBank. Average frequency and the mean absolute deviation of the spectral frequency across pressure channels were determined. LDA was used to classify groups wherein half the data was used to train the classifiers and the other half was used to test the classifiers. Since the choice of data subsets may influence classification performance, random selections of patients and controls for 1000 Monte Carlo simulations were analyzed to yield average performance parameters.
| Table 3 | Achalasia | Clinical Normal | EGJOO | IEM | ||
| Type I | Type II | Type III | ||||
| Accuracy | 0.92±0.03 | 0.87±0.03 | 0.93±0.04 | 0.56±0.05 | 0.76±0.04 | 0.65±0.05 |
| Sensitivity | 0.92±0.14 | 0.70±0.11 | 0.84±0.19 | 0.49±0.09 | 0.54±0.20 | 0.56±0.07 |
| Specificity | 0.96±0.03 | 0.91±0.05 | 0.95±0.03 | 0.75±0.08 | 0.95±0.09 | 0.89±0.06 |
| Positive Predictive Value | 0.87±0.08 | 0.81±0.11 | 0.81±0.11 | 0.80±0.04 | 0.60±0.13 | 0.93±0.03 |
| Negative Predictive Value | 0.94±0.04 | 0.90±0.03 | 0.96±0.04 | 0.44±0.03 | 0.93±0.05 | 0.45±0.04 |
| Area Under ROC Curve | 0.93±0.05 | 0.88±0.06 | 0.95±0.03 | 0.66±0.05 | 0.74±0.09 | 0.85±0.04 |
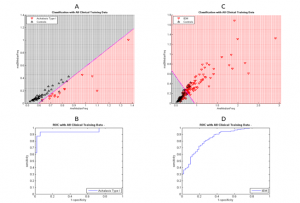
Classification parameters were different depending upon diagnostic group. Substantial values for these parameters were seen for achalasia groups with type I being the best classified. (Table 3) Patients with the remaining diagnoses were poorly classified. Classification ability is further illustrated in the discriminant analysis and ROC plots shown in the figure for type I achalasia patients (figure 11, A and B) and IEM patients (C and D) compared to healthy control data. As seen, achalasia values were distinct from those of healthy controls whereas substantial overlap occurred when comparing IEM and control groups.
Frequency analysis techniques that utilize the entirety of the esophageal isocontour are another tool to classify some, but not all, patient groups. Poor classification of IEM and EGJOO may indicate that the distinguishing characteristics differentiating patients from controls has little to do with esophageal pressure frequency phenomena.
