Testing Group HRM Isocontour Maps
Feasibility and Testing of Group HRM Isocontour Pressure Maps of Centrality and Dispersion to Facilitate Comparison Across Individuals and Conditions
An aggregate database of high resolution esophageal manometric data, the esophageal ManoBank, could serve as a comparative database for delineating the probability of a manometric topography falling within “normal” or “abnormal” ranges by examining the entirety of the pressure data rather than isolated or derived pressure metrics The following establishes the feasibility of a database in the form of aggregate normalized isocontour maps to: 1) Evaluate the deglutitive esophageal isocontours for mean (the average pressure isocontour) as well as the variance of pressure magnitudes (the standard deviation (SD) isocontour) across multiple subjects. 2) Over the entire normalized esophageal deglutitive pressure topography, statistically compare and display the significant pressure differences between dry and 5ml swallows.
We studied 1040 swallows across 52 healthy subjects (50±14 yrs,20F) using a 36 channel (1 cm spacing), HRM catheter. All subjects performed dry and 5 ml water swallows (x10, each). Each swallow was normalized by defining “time zero” as the instant of initial deglutitive upper esophageal sphincter (UES) relaxation and by defining the inter-sphincteric esophageal length. In addition to characterizing average and SD, we also tested the effects of dry versus 5ml swallows on deglutitive pressure topographies using analysis of variance spanning the entire normalized space-time isocontour maps across all subjects.
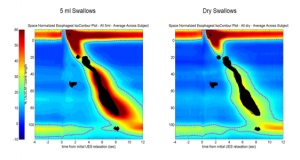
Average and SD isocontours are shown in figure 1 (20 mmHg isobar shown as a dotted line). As seen, average esophageal peristalsis (top row of graphs in figure 1) is well defined but subtly different for dry and wet swallows. These differences are further clarified by the SD isocontours (lower row, figure 1) wherein dry swallows showed less robust contractility especially in the distal esophagus and 5ml water swallows showed greater variability in both the proximal and distal esophagus.
The effects of bolus volume are shown in figure 2 where regions of significant difference (p<0.01, corrected for multiple comparisons) are overlaid in black on the average isocontour map and are seen in the distal esophagus and in the pressure fall-out region of the mid-esophagus (aka “transition zone”).
Thus, group analyses of esophageal deglutitive pressures using topographic techniques provide further insight into esophageal motility not offered by considering individual swallows or derived swallow parameters.


