Symptomatic Patients with “Normal” Esophageal Manometry
Revelations Regarding Symptomatic Patients with “Normal” Esophageal Manometry Using Large Scale Manometric Database Techniques
A significant number of symptomatic patients referred for clinical esophageal manometry exhibit normal manometric findings based on currently established metrics derived from high resolution manometry. This can pose a diagnostic dilemma and a difficult management challenge. We hypothesized that characterization and comparison of the entire deglutitive esophageal isocontour between these manometrically “normal” symptomatic patients (MNSP) and healthy controls may provide enhanced differentiating ability compared to the currently used metrics. Therefore, we seek to test the feasibility of a normalized isocontour database to: 1) Evaluate the deglutitive esophageal isocontours for mean (the average isocontour) as well as the variance of pressure magnitudes (the standard deviation (SD) isocontour) in healthy controls and MNSP. 2) Statistically compare pressure differences over the entire normalized esophageal deglutitive pressure topography, between groups.
Using the data in our recently developed manometry bank, we studied 1610 swallows in 52 healthy subjects (50±14 yrs,20F) and 109 symptomatic patients. (52±16, 56F). MNSP were defined using the Chicago Classification criteria. All subjects performed 5 ml water swallows (x10). Each swallow was normalized by defining “time zero” as the instant of initial deglutitive upper esophageal sphincter (UES) relaxation and by defining the inter-sphincteric esophageal length. In addition to characterizing average and SD, we also tested the disease-related differences in deglutitive pressure topographies using analysis of variance spanning the entire normalized isocontour across all subjects.
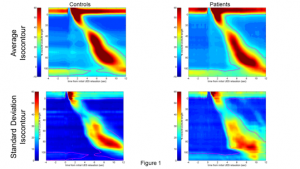
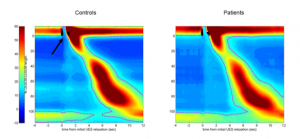
 Average and SD group isocontours are shown in figure 3 (20 mmHg isobar is shown as a dotted line). As seen, average esophageal peristalsis (top row of figure 3) is well defined and is similar for control and patient groups. These similarities are further clarified by the SD isocontours (lower row of figure 3). The significant group-wise effects are shown in figure 4 where regions of significant difference (p<0.0001) are overlaid in black. While no significant differences were detected in the body of the esophagus,
  significant differences were found in the distal portion of the pharyngo-esophageal junction just prior to and after UES deglutitive relaxation.
Group analyses of esophageal deglutitive pressures using topographic techniques showed abnormalities outside the distal smooth muscle esophagus such as pharyngo-esophageal junction and proximal esophagus should be considered as sources of symptoms in symptomatic patients with normal esophageal manometry.
