Pharyngeal Pressure Analyses
Normalized Data for Group Analyses of Manometric and Impedance Data
Due to anatomic and physiologic variability, comparison of pressure or impedance isocontours within and across subjects is a difficult problem. While analyses of high resolution manometry (HRM) studies associated with swallowing motility of the pharynx and esophagus using derived metrics like contractile integrals and contractile front velocities have been productive sources of insight for understanding motility, comparative analyses of pressure and impedance isocontour data across space and time have not been realized. Some of the major impediments in comparing pressure data across swallows and/or subjects are the paucity of large archives of HRM data to overcome the problem of accurately estimating the mean and variance of pressure or impedance as well as the need to normalize the physical and temporal dimensions of manometric data to make isocontour comparison meaningful.
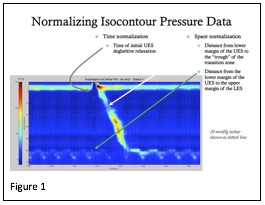
 Normalization of isocontour pressure and impedance in time and space domains may be realized in many ways. In the absence of information other than HRM data, normalization must be limited to characteristics within the isocontour display alone. A schematic representation of possible time and space normalization of the esophageal isocontour is shown in figure 1. As seen, time may be normalized by choosing a point in the isocontour as “time zero” such as the time of manometric deglutitive relaxation of the upper esophageal sphincter (UES). Normalizing the length of the esophagus could be achieved by scaling the isocontour to the distance from the lower margin of the UES high pressure zone demarcated by the 20-mmHg isobar to the upper margin of the esophago-gastric high-pressure zone (marked by the 20-mmHg isobar). Another characteristic length could be the length from the lower margin of the UES to the low pressure “trough” of the esophageal transition zone (figure 1).
Even if with the impediment associated with normalization resolved, what are the uses for comparisons of isocontour data within and between subjects? Comparisons of normalized pressure or impedance isocontours have many of the same attractive features of viewing HRM data in the isocontour format; namely, description of a variable (pressure or impedance or both) is both space and time expressed in a single, graphic format. Similarly, differences in normalized isocontour data could be tested and shown in the same format thereby yielding information on where and when pressure or impedance differences occur. There are many scenarios in which normalized isocontour testing could be utilized including (but not limited to):
- Group-wise comparisons between healthy and disease populations or within disease populations could be tested for pressure phenomena in the esophagus, pharynx or both organs
- Comparison of individual patient manometric data against healthy, aggregate values as well as comparison against aggregate data of previously diagnosed patient studies
- Comparison of conditions (age, sex, volume effects) for pharyngeal and/or esophageal pressure data
