Example of ManoBank Pharyngeal Analyses
As an example of a pharyngeal HRM application of one of the previously mentioned scenarios, we studied 26 healthy subjects (54±14 yrs,13F) using a 36 channel (1 cm spacing), HRM catheter.
Aims
Our aims were to establish the feasibility of a database in the form of aggregate normalized isocontour maps to:
- Evaluate the deglutitive pharyngeal isocontours for mean pressure magnitudes (the average pressure isocontour) as well as the variance of pressure magnitudes (the standard deviation (SD) isocontour) across multiple subjects.
- Over the entire normalized pharyngeal deglutitive pressure topography, statistically compare and display the times and regions of significant pressure differences for three swallowed volumes.
Methodology
All subjects performed dry, 5 and 10 ml water swallows (x3). Pressure data was analyzed in the MATLAB (MathWorks, Natick, MA) programming environment. Each swallow was normalized by defining “time zero” as the instant of initial deglutitive UES relaxation and by defining the length of the contractile pharynx from the velopharynx to the upper margin of the UES.

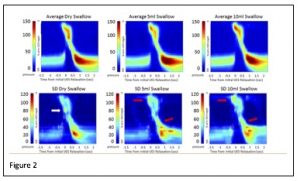
Figure 2
We also tested the effects of bolus volume on deglutitive pressure topographies using analysis of variance spanning the entire normalized space-time pressure maps across all subjects.
Average and SD isocontours are shown in figure 2 (20 mmHg isobar is shown as a dotted line). As seen, average pharyngeal peristalsis (top three graphs in figure 2) is well defined but subtly different for each volume.

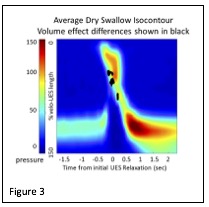
Figure 3
The effects of bolus volume are shown in figure 3 where regions of significant difference (p<0.0001) are overlaid in black on the average isocontour map and are seen in the mid-pharyngeal region at the interface between the contractile portion of the isocontours and the regions preceding the contractile activity.
Conclusions
We conclude from these findings that group analyses of pharyngeal deglutitive pressures using topographic techniques provide further insight into pharyngeal motility not offered by considering individual swallows or derived swallow parameters. These techniques afford hitherto unreported findings and opportunities regarding variability of pressure data that may be difficult to show using derived parameters like peak pressure and integrated pressure metrics.
